Diodes IIElectronics guide > Diodes II
In the last chapter, we took a detailed look at diodes and their characteristic curves. This chapter we’re going to take this one stage further and consider how we use the characteristic curve to define how the diode will operate in any particular circuit. Finally, we’ll look at a number of circuits which show some of the many uses of ordinary diodes.
The components you’ll need for the circuits this chapter are:
- 1 x 10 k resistor
- 2 x 15 k resistors
- 2 x 100 k resistors
- 1 x 10 μF 10 V electrolytic capacitor
- 1 x 220 μF 10 V electrolytic capacitor
- 1 x 1N4001 diode
- 1 x LED
- 1 x 555 integrated circuit
Figure 7.1 shows the forward biased section of a typical diode characteristic curve. It has a transition voltage of about 0V7, so you should know that it’s the characteristic curve of a silicon diode.
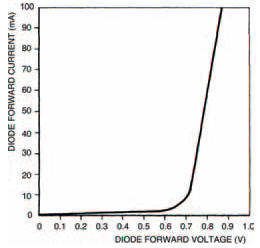
Figure 7.1 The forward biased section of the characteristic curve of a silicon diode
Diodes aren’t the only electronic components for which characteristic curves may be drawn — most components can be studied in this way. After all, the curve is merely a graph of the voltage across the component compared to the current through it. So, it’s equally possible that we draw a characteristic curve of, say, a resistor. To do this we could perform the same experiment we did last chapter with the diodes: measuring the voltage and current at a number of points, then sketching the curve as being the line which connects the points marked on the graph.
But there’s no need to do this in the case of a resistor, because we know that resistors follow Ohm’s law. We know that:

where R is the resistance, V is the voltage across the resistor, and I is the current through it. So, for any value of resistor, we can choose a value for, say, the voltage across it, and hence calculate the current through it. Figure 7.2 is a blank graph. Calculate and then draw on the graph characteristic curves for two resistors: of values 100 Ω and 200 Ω. The procedure is simple: just calculate the current at each voltage point for each resistor.
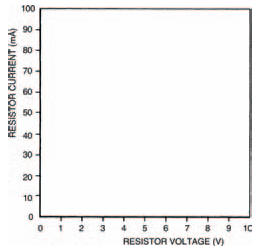
Figure 7.2 A blank graph for you to fill in — see the text above for instructions
Your resultant characteristic curves should look like those in Figure 7.3 — two straight lines.
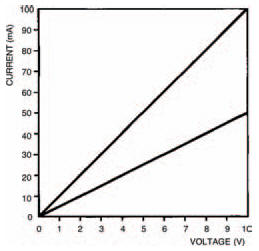
Figure 7.3 Your efforts with Figure 7.2 should produce a graph something like this
Take note
Resistor characteristic curves are straight lines because resistors follow Ohm’s law (we say they are ohmic) and Ohm’s law is a linear r e l a t i o n s h i p . S o r e s i s t o r c h a r a c t e r i s - tic curves are linear, too. And because they are linear there’s really no point in drawing them, and you’ll never see them in this form anywhere else — we drew them simply to emphasise the principle.
We need to draw diode characteristic curves, on the other hand, because they’re non-ohmic and hence, non-linear. So to see what current passes through the device with any particular voltage across it, it’s useful to see its characteristic curve. This is generally true of any semiconductor device, as we’ll see in later chapters.
<< Reverse bias