Getting results
As well as watching what happens when the circuit is switched on, you should make a record of the voltages displayed by the meter, every few seconds. To help you do this a blank table of results is given in Table 4.1. All you have to do is fill in the voltages you have measured, at the times given, into the table at successive measurement points. You’ll find that the voltage increases from zero as you switch the circuit on, rapidly at first but slowing down to a snail’s pace at the end. Don’t worry if your measurements of time and voltage aren’t too accurate — we’re only trying to prove the principle of the experiment, not the exact details. Besides, if you switch off and then short circuit the capacitor, as already described, you can repeat the measurements as often as required.
Table 4.1 Results of your measurements
When you’ve got your results, transfer them as points onto the blank graph of Figure 4.6 and sketch in a curve which goes approximately through all the points. Table 4.2 and Figure 4.7 show results obtained when the experiment was performed in preparing this book.
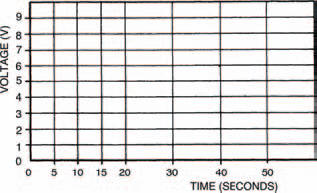
Figure 4.6 A blank graph to plot your measurements. Use Table 4.1 above with it to record your measurements
Table 4.2 Our results while preparing this book
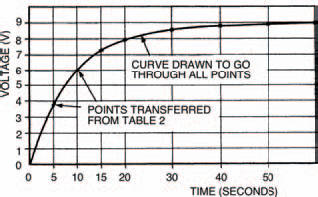
Figure 4.7 The results of our experiments
What you should note in your experiment is that the voltage across the capacitor (any capacitor, in fact) rises, not instantaneously as with the voltage across a resistor, but gradually, following a curve. Is the curve the same, do you think, for all capacitors? Change the capacitor for one with a value of 220 μF (about half the previous one). Using the blank table of Table 4.3 and blank graph in Figure 4.8, perform the experiment again, to find out.
Table 4.3 The results of your measurements
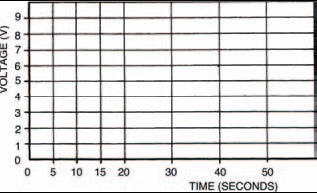
Figure 4.8 A blank graph to plot your measurements. Use Table 4.3 shown above as well
Table 4.4 and Figure 4.9 show the results of our second experiment (yours should be similar) which shows that although the curves of the two circuits aren’t exactly the same as far as the time axis is concerned, they are exactly the same shape. Interesting, huh?
Table 4.4 The results of our second experiment
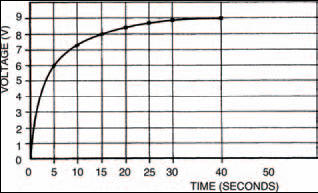
Figure 4.9 A graph showing our results of the second experiment
This proves that the rising voltage across a capacitor follows some sort of law. It is an exponential law, and the curves you obtained are known as exponential curves. These exponential curves are related by their time constants. We can calculate any rising exponential curve’s time constant, as shown in Figure 4.10, where a value of 0.63 times the total voltage change cuts the time axis at a time equalling the curve’s time constant, τ (the Greek letter tau).
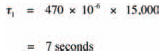
In a capacitor circuit like that of Figure 4.4, the exponential curve’s time constant is given simply by the product of the capacitor and resistor value. So, in the case of the first experiment, the time constant is:
and, in the case of the second experiment:
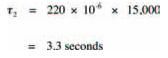
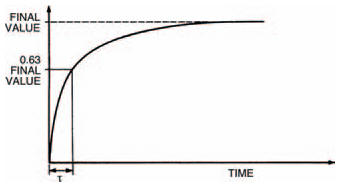
Figure 4.10 A graph showing an exponential curve, related to the time constant
You can check this, if you like, against your curves, or those in Figures 4.7 and 4.9, where you will find that the times when the capacitor voltage is about 5V7 (that is, 0.63 times the total voltage change of 9 V) are about 8 seconds and 4 seconds. Not bad when you consider possible experimental errors: the biggest of which is the existence of the meter resistance.
Hint:
One final point of interest about exponential curves, before we move on, is that the measurement denoted by the curve can be taken to be within about 1% of its final value after a time corresponding to five time constants. Because of this, it’s taken as a rule-of-thumb by electronics engineers that the changing voltage across a capacitor is complete after 5τ.
<< Measuring up